Crop Health Assesment
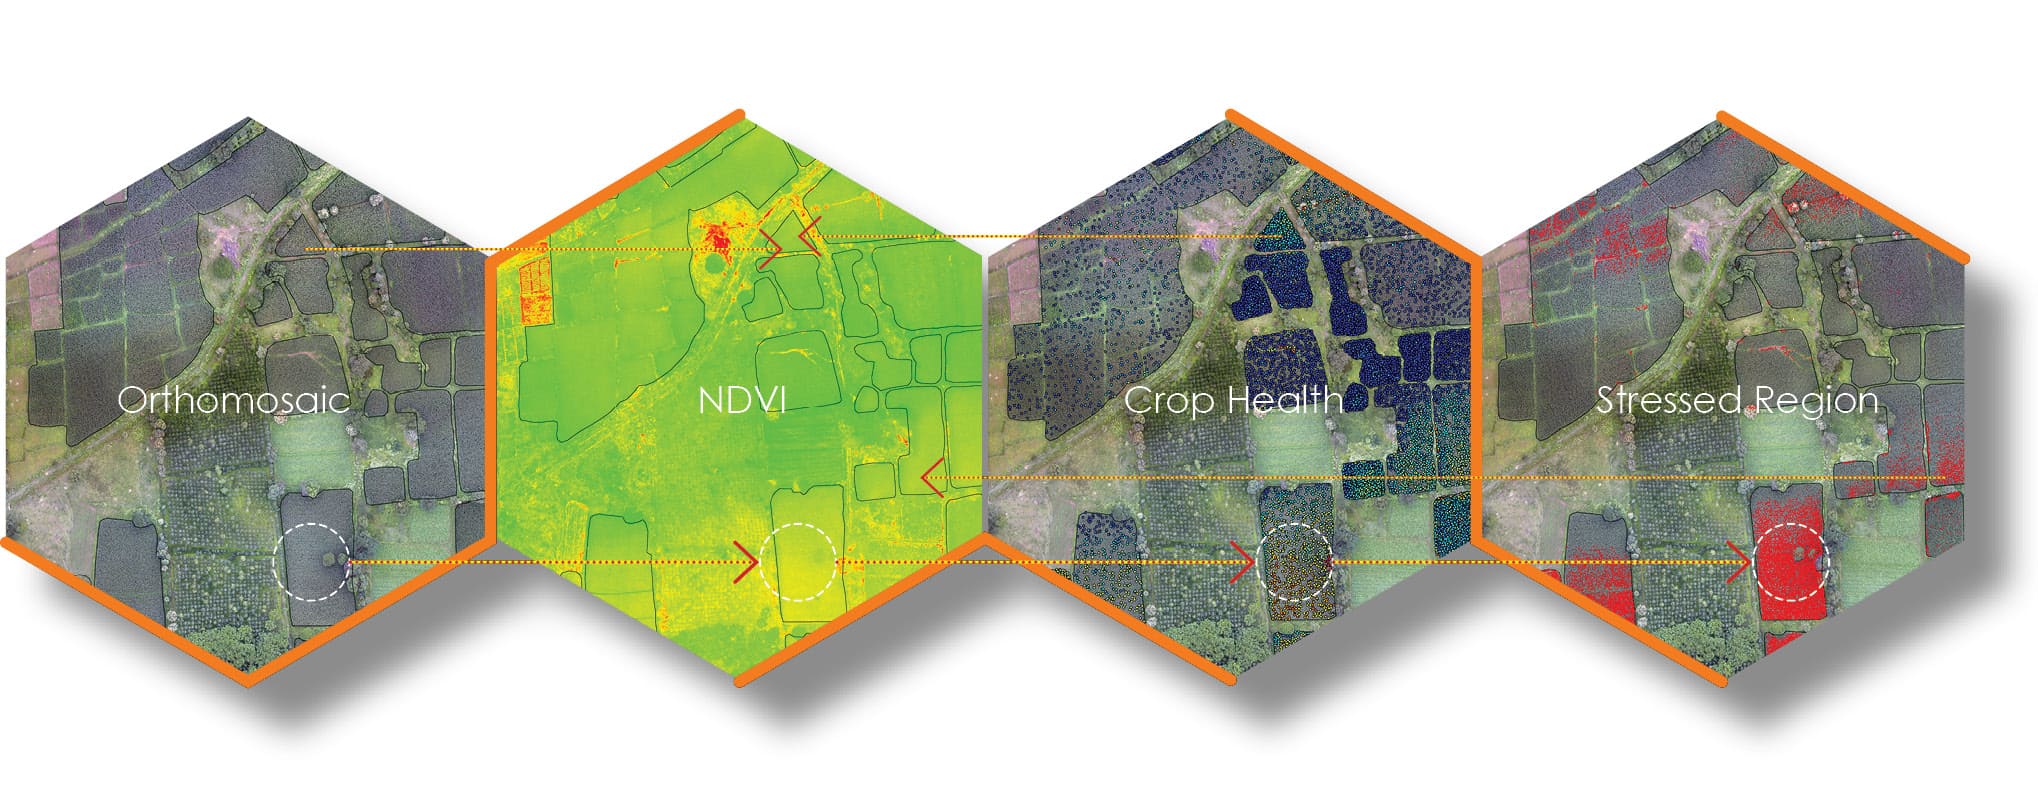
Crop Health Map
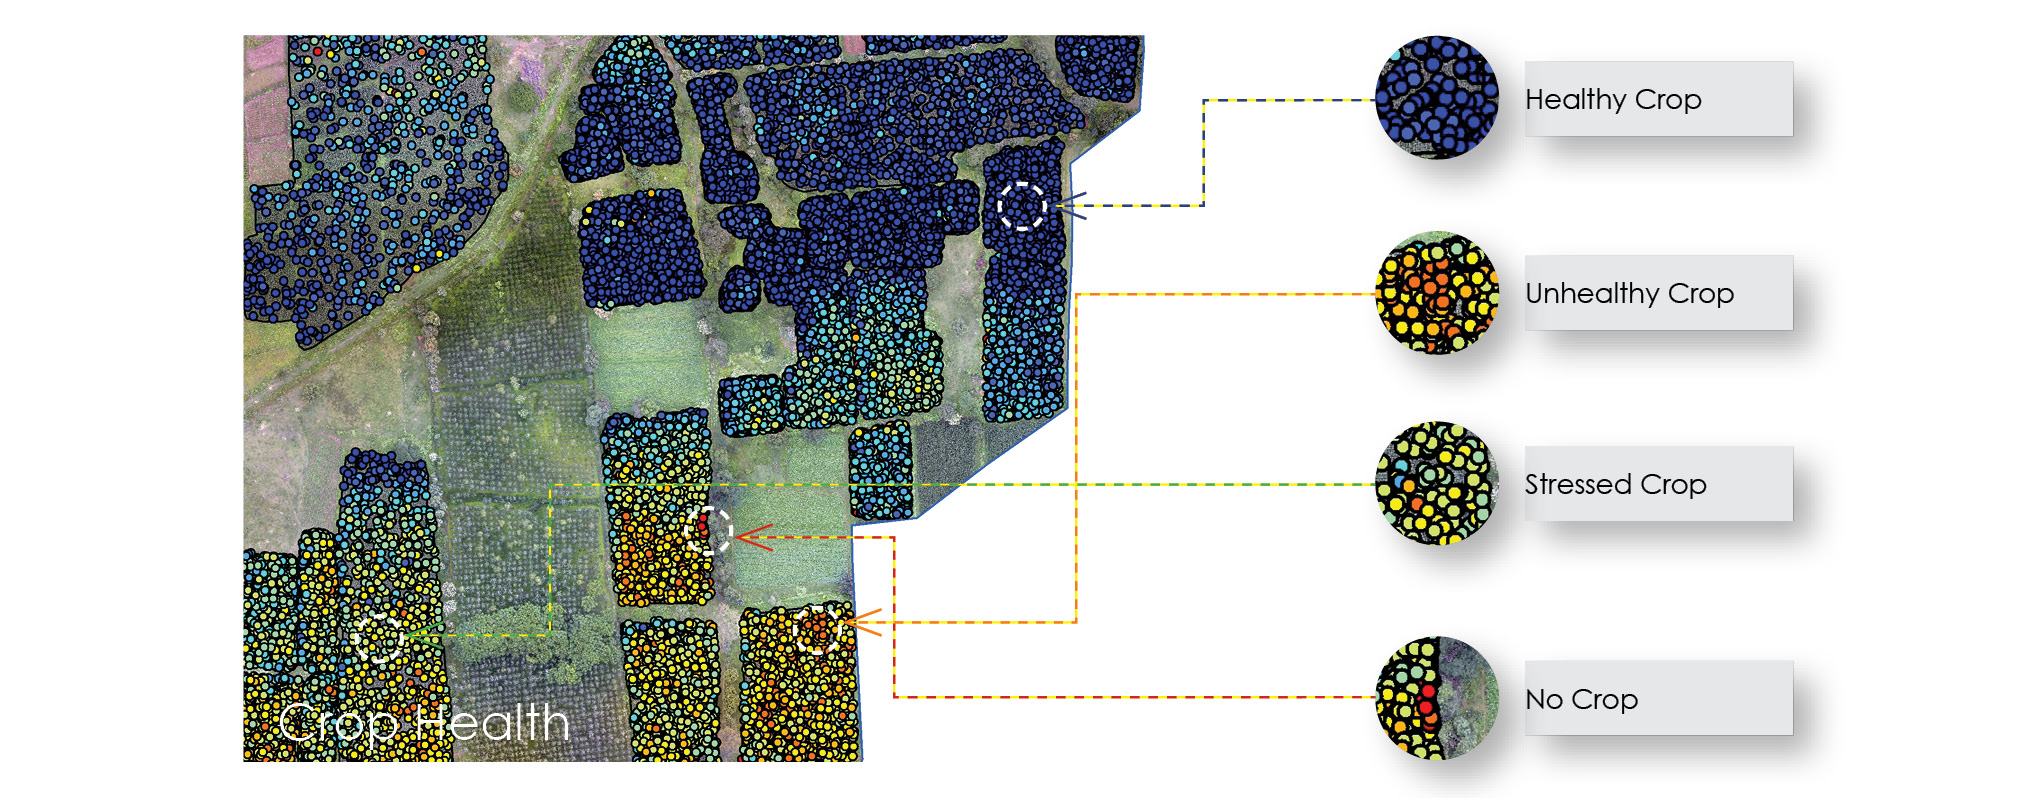
To understand the crop health data, an overlay map is generated to give an easy idea of analysis of the site. The points generated here on the maps carry the crop health information and pinpoint location information with an accuracy of 3 cm (approx.).
Stressed Crop Region
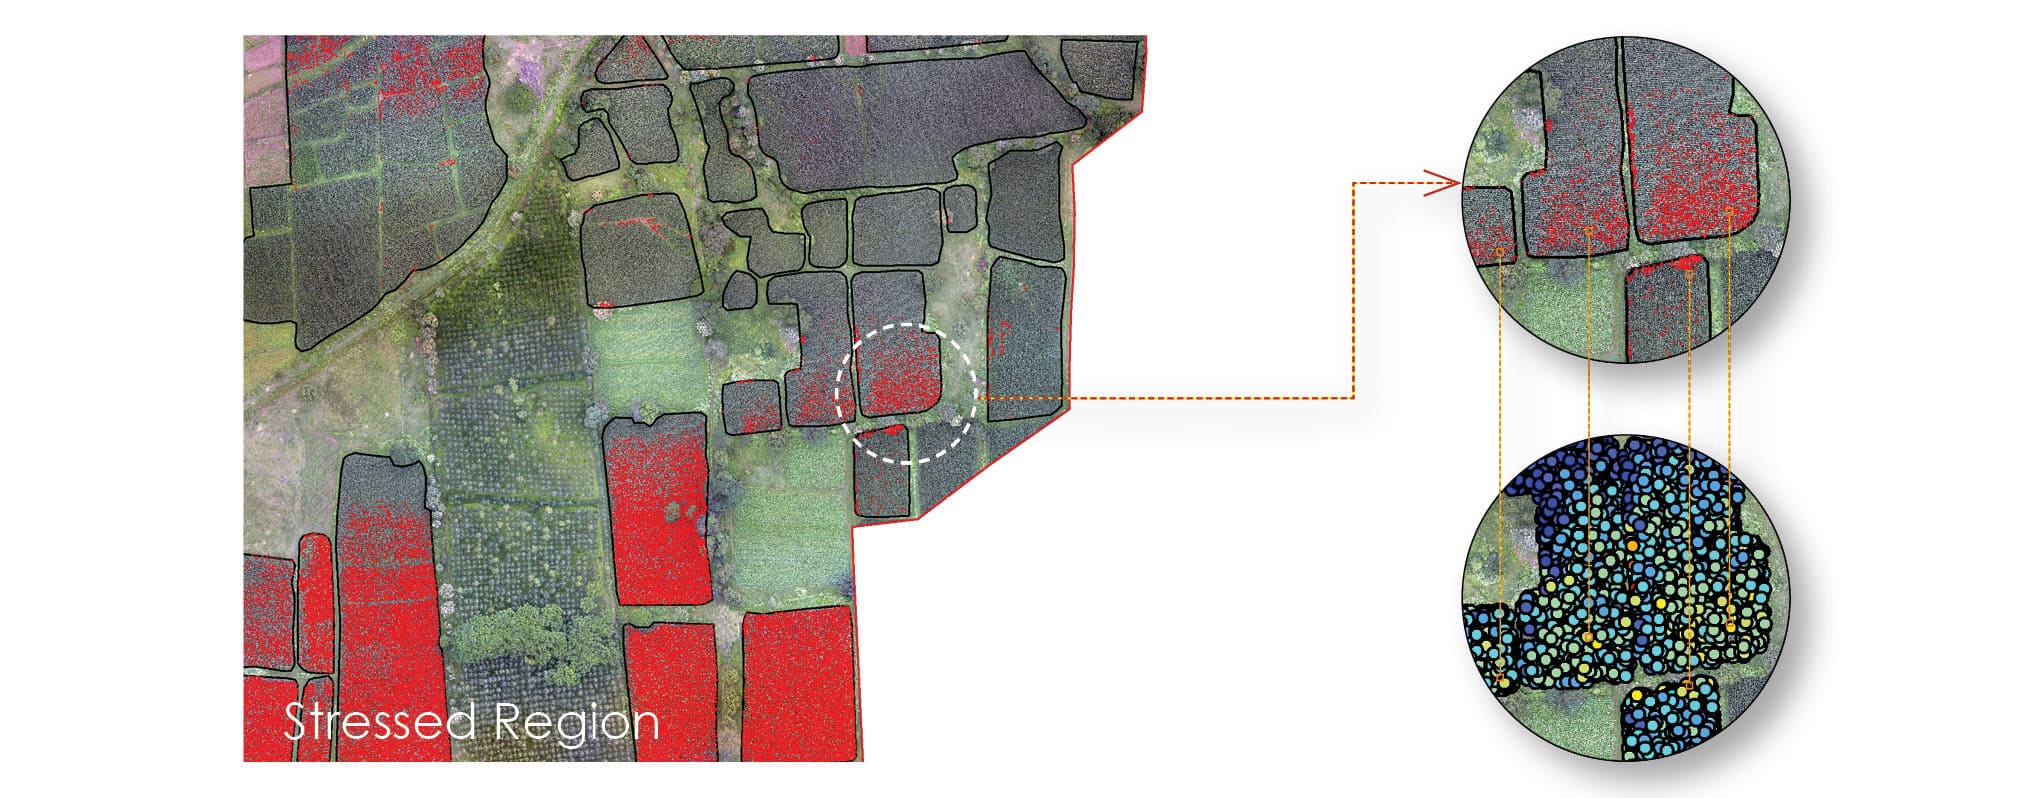
To identify the area of the stressed crop region the random points with the NDVI index values are used. The points indicating the stressed region are extracted and given a buffer of 0.3m (1 ft). From the Orthomosaic, the plant covering radius if 0.3m is observed. These generated buffers are merged to avoid overlaps and miscalculations and generate a crisp area of stressed crop.
How NDVI Works
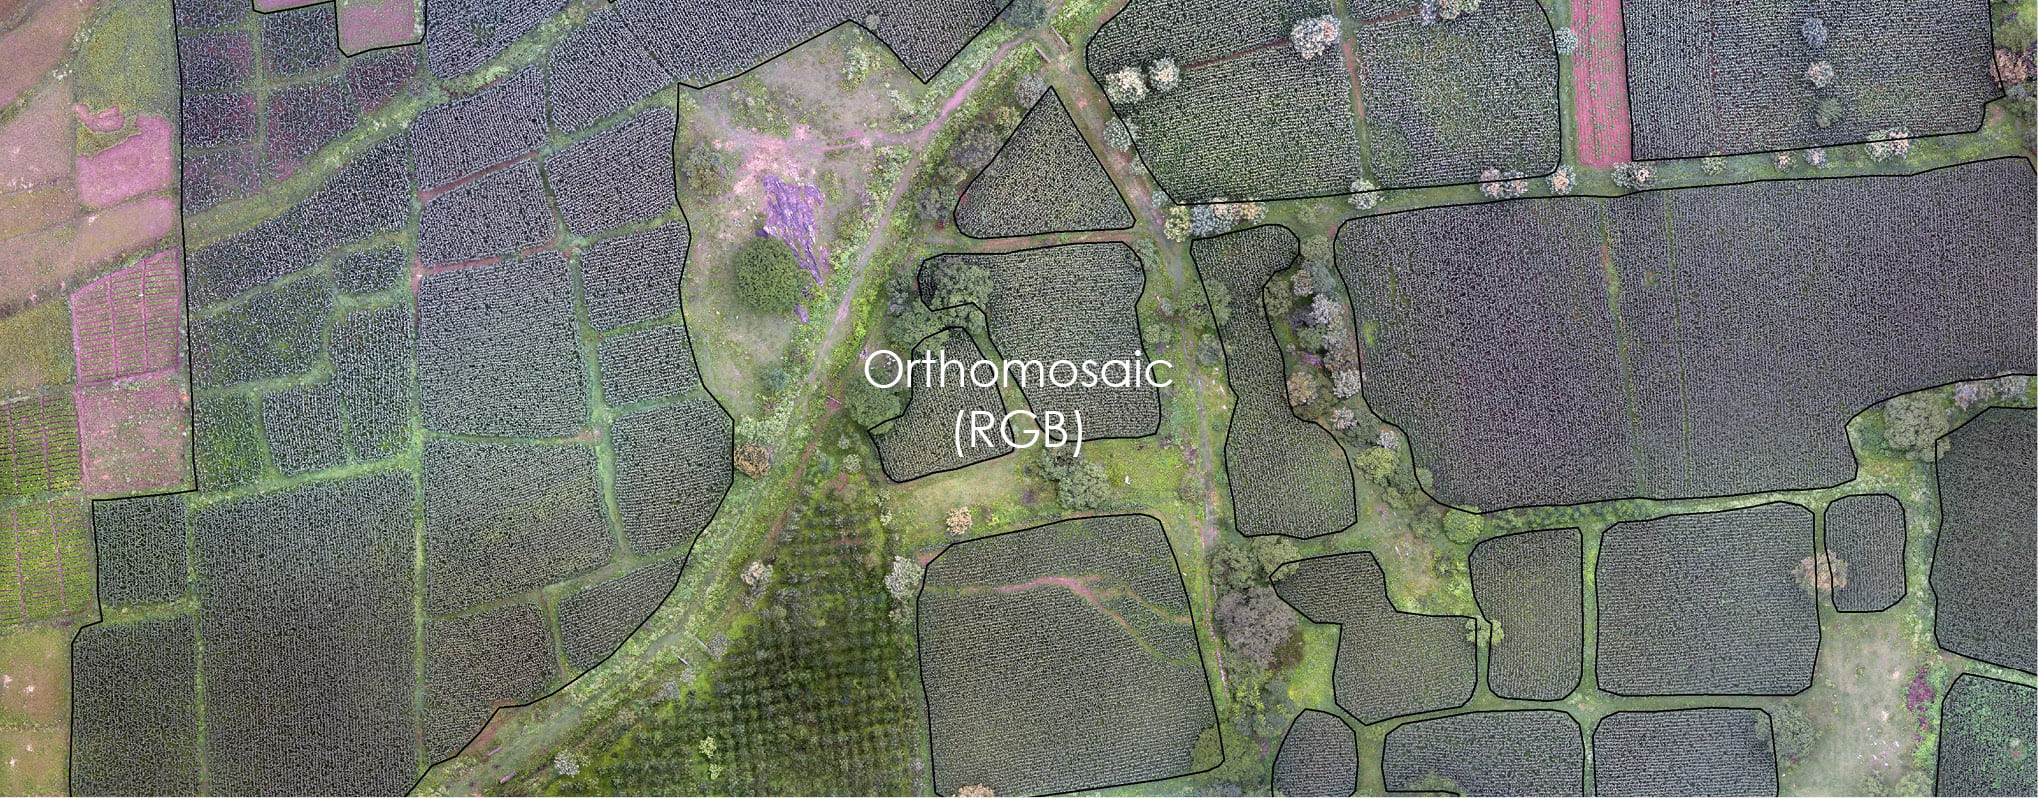
Orthomosaic
The images were captured in 4 bands (Red Green Blue & NIR resp.) using a multispectral camera on a drone. Here the orthomosaic consist of three bands RGB resp., with the help of image processing software with millimeter level accuracy. Further NDVI is generated using NIR & Red band.
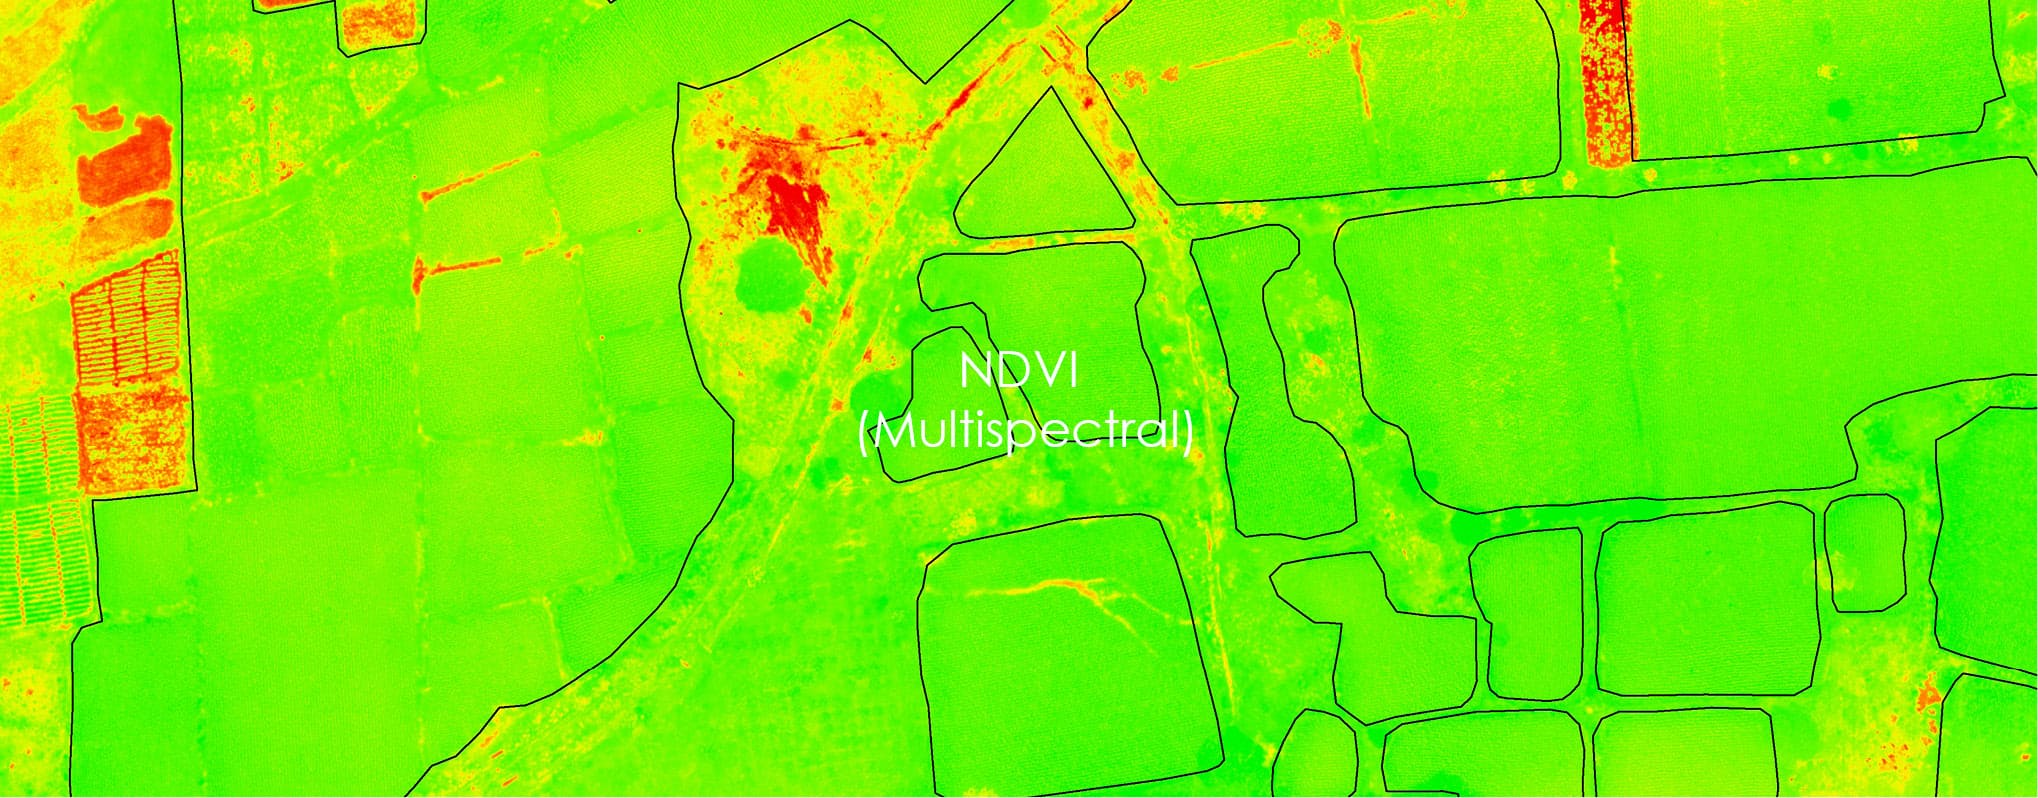
NDVI
Normalized Differential Vegetation Index (NDVI) determines the relative greenness of the vegetation. Red & NIR bands provide us the NDVI output. The index ranges from -1 to 1. Where, -1 to 0 ranges for soil, water, and snow. from 0 - 0.15 is the range for an unhealthy crop, 0.15 - 0.30 is the range for a stressed crop & above 0.30 indicates a healthy crop.
